<div dir="ltr" style="text-align: left;" trbidi="on">Now the new opportunity has appeared to embed animated maps in your site or blog. Have a look at the example of such embedding on the Map 1 andin Figure 1a (source map). This article uses the maps that contain a lot of animated data, and therefore for their correct displaying the fast internet is desired. If you have a problem with the map displaying, try to refresh the page.
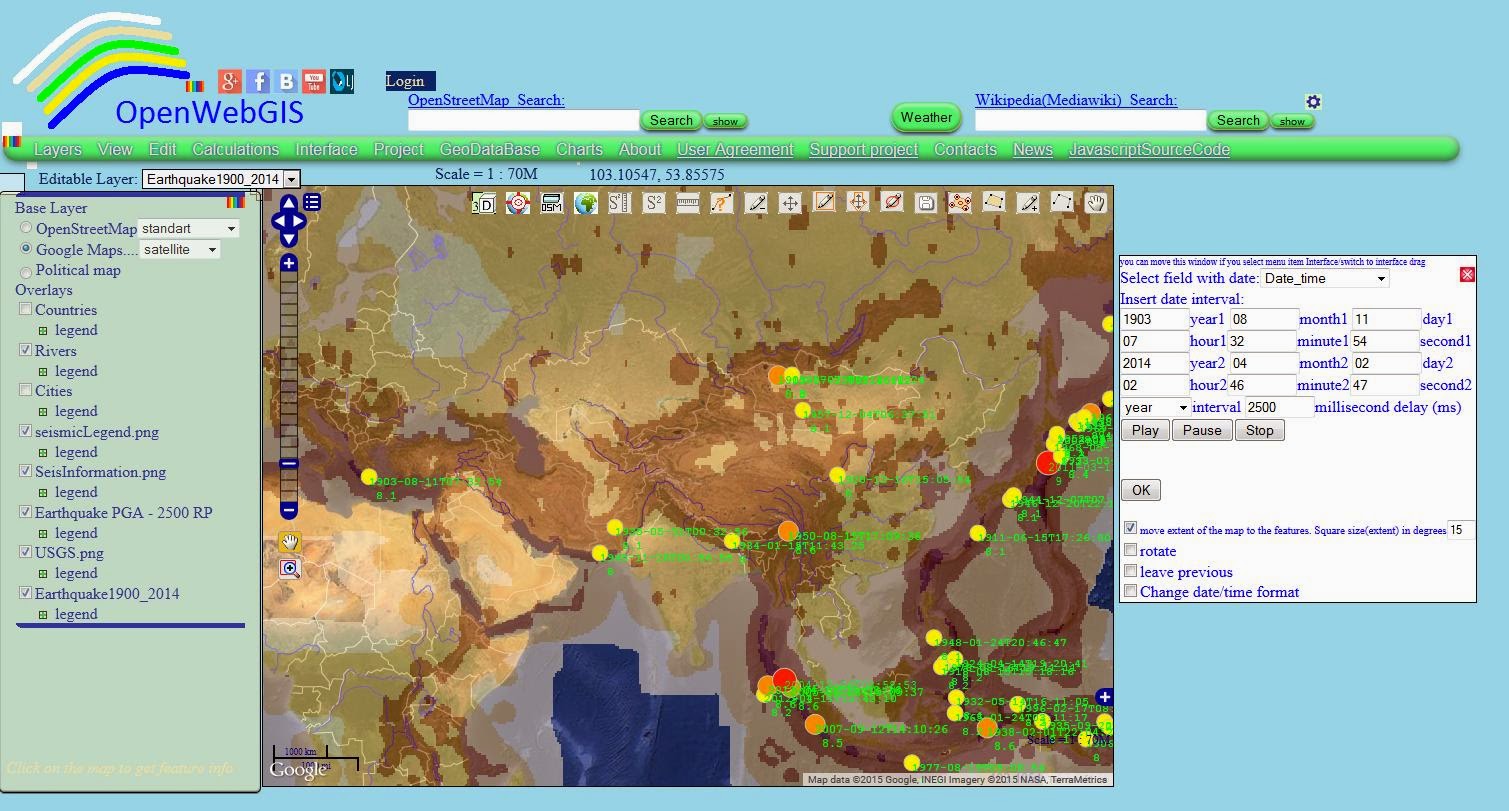 Figure 1a.
Map 1-The animated map of the earthquakes all over the world with magnitude 8 and more in 1900-2014 years. For this map the time interval for each year is set - 2500 milliseconds. For further information about this map you can read here
Animated maps in OpenWebGIS are understood as maps, on which there are layers containing the attribute with the date/time values and where with the help of the "Time Line" function is started the process of layer changes drawing according to date/time changes.
You don`t need any longer to create a video for your readers to see your map dynamics or write the instructions about what button they need to press to start anomation. After map embedding acoording to instructions given below, the map will be automatically animated with your settings. As examples in this article the maps of Atlantic Hurricane Tracks (in 1851-2004 years) and earthquakes (with magnitude 8 and more in 1900-2014 years) are shown. You can read in more detail about these maps and about data for their creation here and here. http://openwebgis.livejournal.com/7794.html
In order to embed animated map you must:
1. Select the name of your layer (for example, "Hurricanes1851-2004") in 'Editable Layer' drop-down list, like it is shown in Figure 1.
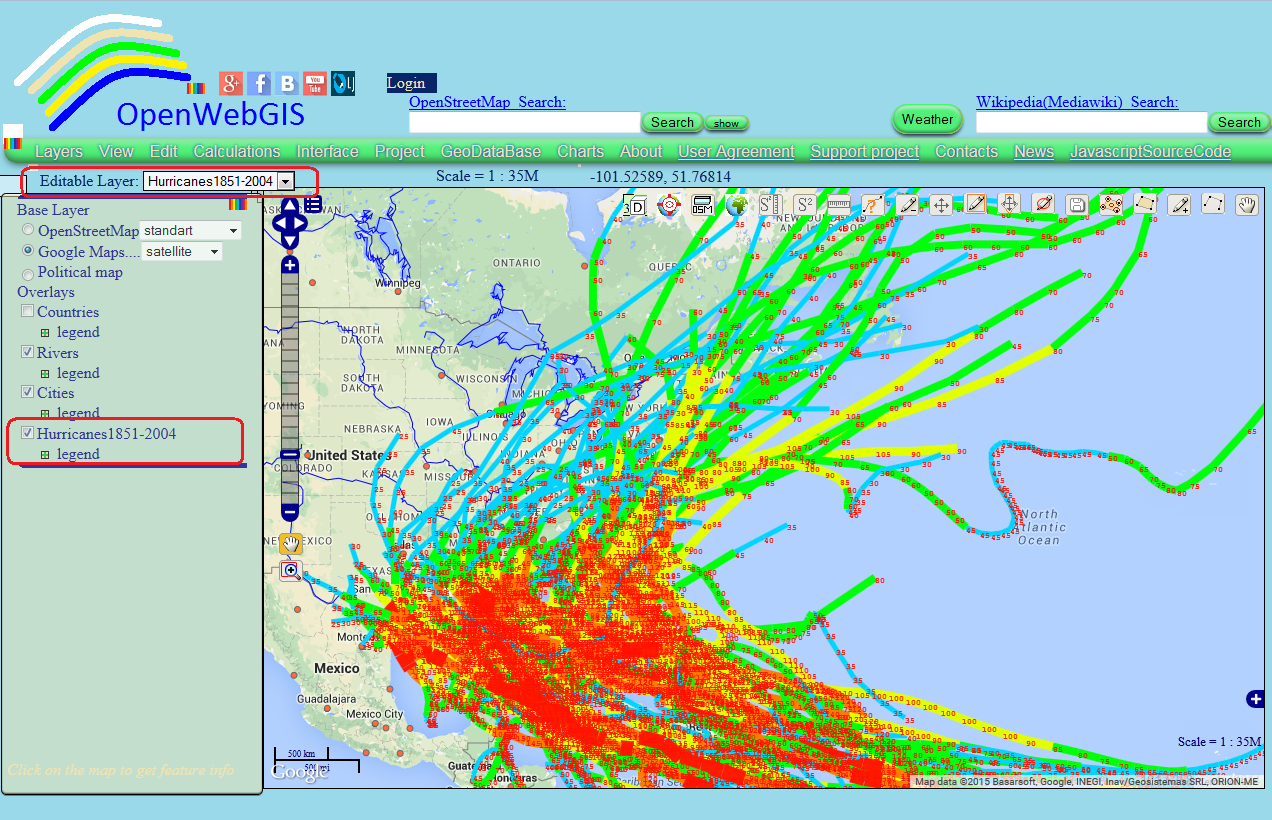 Figure 1.
2. Click on menu item "View"->"Time Line", like it is shown in Figure 2.
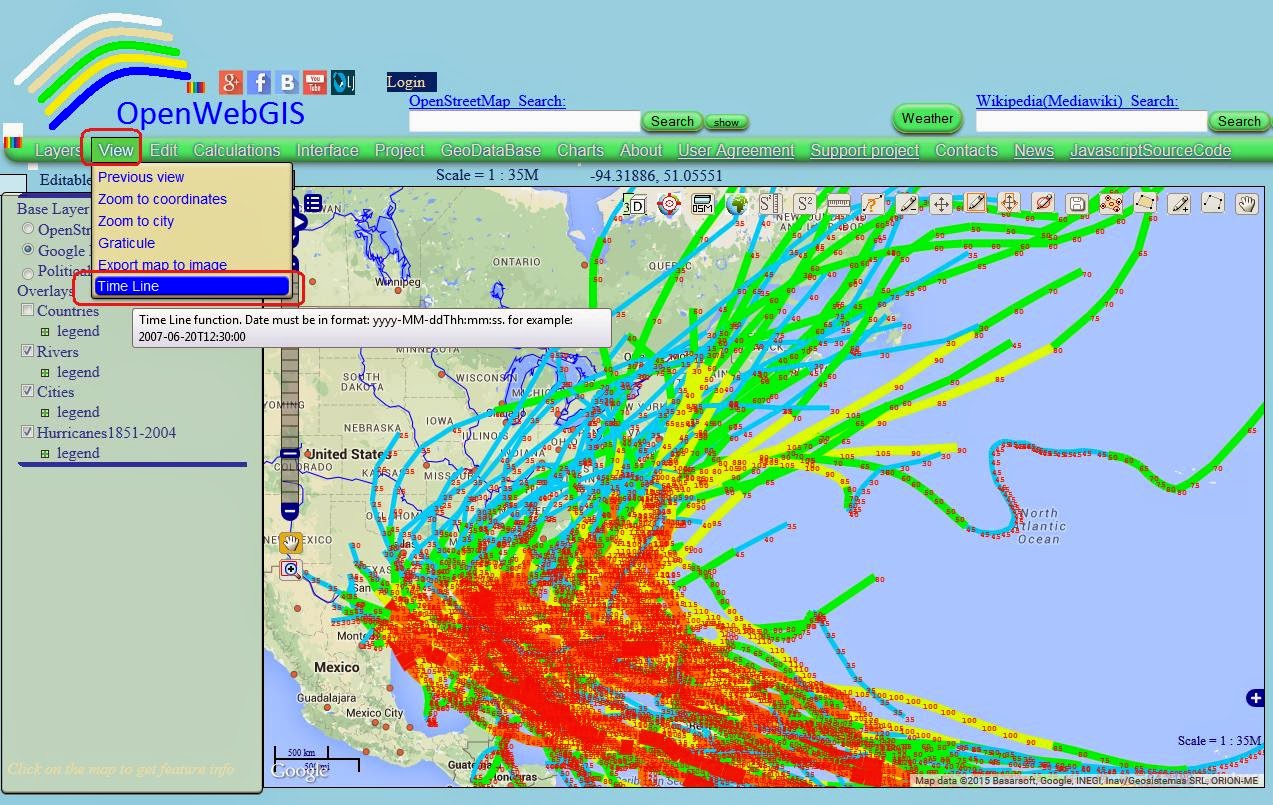 Figure 2.
3. In opened popup window select the field (attribute) with date –(in our case the name of this field is "DATEYEAR"). See Figure 3. Dates/times in the field with date must be in format ISO8601:yyyy-mm-ddThh:mm:ss (for example:"1851-08-17T18:00:00"). It is necessary for animation in OpenWebGIS.
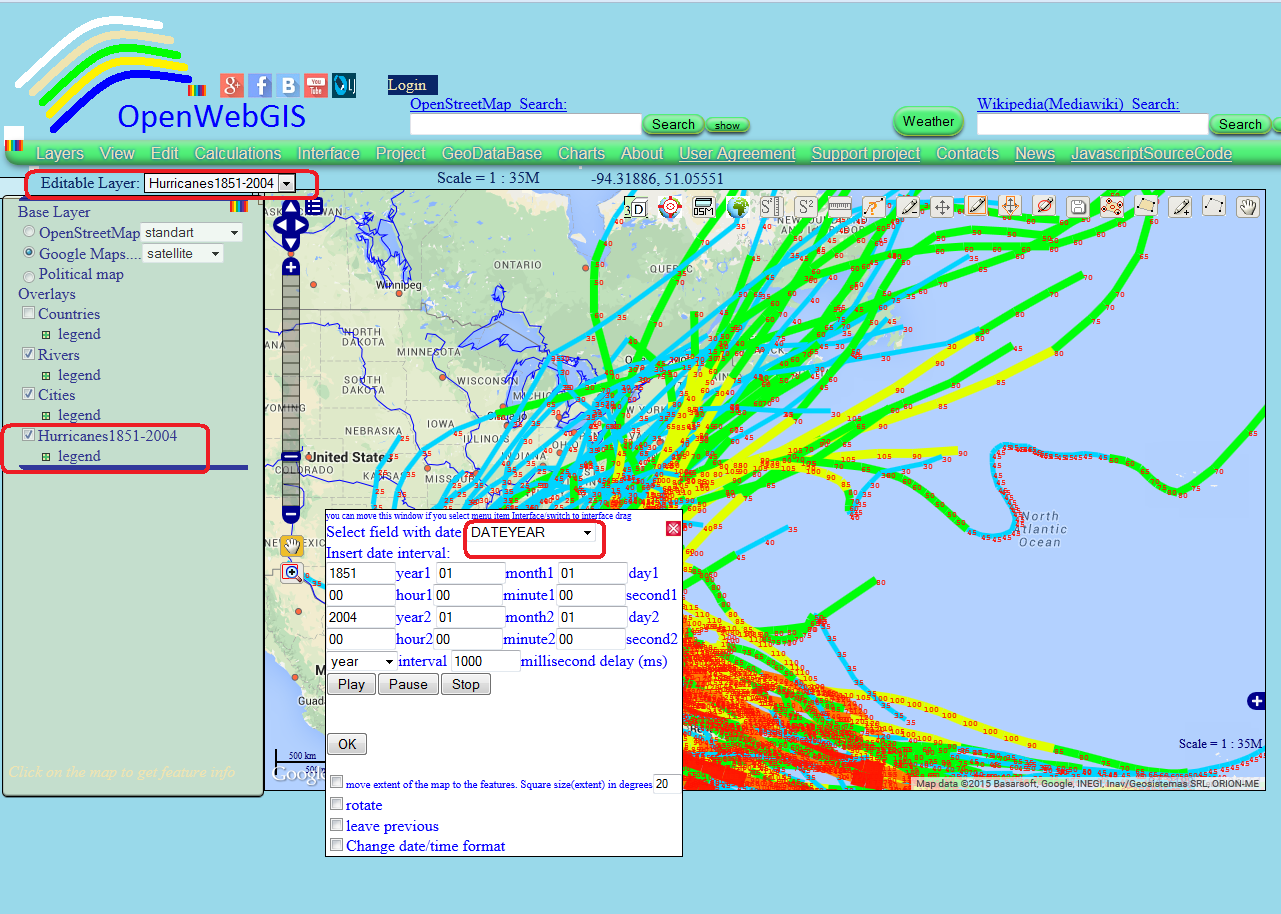 Figure 3.
<div class="MsoNormal">
Figure 1a.
Map 1-The animated map of the earthquakes all over the world with magnitude 8 and more in 1900-2014 years. For this map the time interval for each year is set - 2500 milliseconds. For further information about this map you can read here
Animated maps in OpenWebGIS are understood as maps, on which there are layers containing the attribute with the date/time values and where with the help of the "Time Line" function is started the process of layer changes drawing according to date/time changes.
Instruction on how to animate your OpenWebGIS map can be read in this article: http://openwebgis.livejournal.com/643.html or see this video:
In order to embed animated map you must:
1. Select the name of your layer (for example, "Hurricanes1851-2004") in 'Editable Layer' drop-down list, like it is shown in Figure 1.
Figure 1.2. Click on menu item "View"->"Time Line", like it is shown in Figure 2.
Figure 2.3. In opened popup window select the field (attribute) with date –(in our case the name of this field is "DATEYEAR"). See Figure 3. Dates/times in the field with date must be in format ISO8601:yyyy-mm-ddThh:mm:ss (for example:"1851-08-17T18:00:00"). It is necessary for animation in OpenWebGIS.
Figure 3.<div class="MsoNormal">