<div dir="ltr" style="text-align: left;" trbidi="on">
What is a spatial interpolation?
Interpolation predicts values for cells in a raster from a limited number of sample data points. It can be used to predict unknown values for any geographic point data: elevation, rainfall, chemical concentrations, noise levels, and so on.
It is important to understand that the interpolated values are approximations only of the real values of the surface and that the interpolated values differ depending upon the interpolation method used.
Why interpolate?
Visiting every location in a study area to measure the height, magnitude, or concentration of a phenomenon is usually difficult or expensive. Instead, dispersed sample input point locations can be selected and a predicted value can be assigned to all other locations. Input points can be either randomly, strategically, or regularly spaced points containing height, concentration, or magnitude measurements.
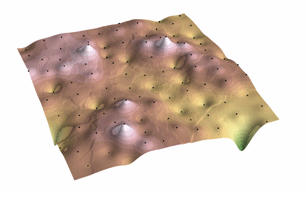
<div>A typical use for point interpolation is to create an elevation surface from a set of sample measurements. Each point represents a location where the elevation has been measured. The values between these input points are predicted by interpolation.

There are effectively two types of techniques for generating raster surfaces
Deterministic Models use a mathematical function to predict unknown values and result in hard classification of the value of features.
GeoStatistical Techniques produce confidence limits to the accuracy of a prediction but are more difficult to execute since more parameters need to be set.
Deterministic Models
Deterministic models include Inverse Distance Weighted (IDW), Rectangular, Natural Neighbours, and Spline. You can also develop a trend surface using polynomial functions to create a customized and highly accurate surface.
<h2 style="text-align: justify;">
The IDW technique calculates a value for each grid node by examining surrounding data points that lie within a user-defined search radius. The node value is calculated by averaging the weighted sum of all the points. A radius is generated around each grid node from which data points are selected to be used in the calculation.
Options to control the use of IDW include
<div class="MsoListParagraphCxSpFirst" style="text-indent: -0.25in;"><span style="font-family: Wingdings; font-size: 16.0pt; line-height: 107%; mso-bidi-font-family: Wingdings; mso-bidi-font-weight: bold; mso-fareast-font-family: Wingdings;">
أكثر...

What is a spatial interpolation?
Interpolation predicts values for cells in a raster from a limited number of sample data points. It can be used to predict unknown values for any geographic point data: elevation, rainfall, chemical concentrations, noise levels, and so on.
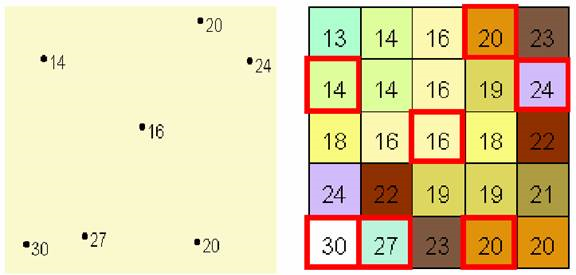
On the left is a point dataset of known values. On the right is a raster interpolated from these points. Unknown values are predicted with a mathematical formula that uses the values of nearby known points.
Interpolation is based on the assumption that spatially distributed objects are spatially correlated; in other words, things that are close together tend to have similar characteristics.
It is important to understand that the interpolated values are approximations only of the real values of the surface and that the interpolated values differ depending upon the interpolation method used.
Why interpolate?
Visiting every location in a study area to measure the height, magnitude, or concentration of a phenomenon is usually difficult or expensive. Instead, dispersed sample input point locations can be selected and a predicted value can be assigned to all other locations. Input points can be either randomly, strategically, or regularly spaced points containing height, concentration, or magnitude measurements.
<div>A typical use for point interpolation is to create an elevation surface from a set of sample measurements. Each point represents a location where the elevation has been measured. The values between these input points are predicted by interpolation.
There are effectively two types of techniques for generating raster surfaces
Deterministic Models use a mathematical function to predict unknown values and result in hard classification of the value of features.
GeoStatistical Techniques produce confidence limits to the accuracy of a prediction but are more difficult to execute since more parameters need to be set.
Deterministic Models
Deterministic models include Inverse Distance Weighted (IDW), Rectangular, Natural Neighbours, and Spline. You can also develop a trend surface using polynomial functions to create a customized and highly accurate surface.
<h2 style="text-align: justify;">
1
Inverse Distance Weighting (IDW)
The IDW technique calculates a value for each grid node by examining surrounding data points that lie within a user-defined search radius. The node value is calculated by averaging the weighted sum of all the points. A radius is generated around each grid node from which data points are selected to be used in the calculation.
Options to control the use of IDW include
<div class="MsoListParagraphCxSpFirst" style="text-indent: -0.25in;"><span style="font-family: Wingdings; font-size: 16.0pt; line-height: 107%; mso-bidi-font-family: Wingdings; mso-bidi-font-weight: bold; mso-fareast-font-family: Wingdings;">
أكثر...