Almost in every Geographic information system (GIS) there is an opportunity to create maps (vector map layers) from files in CSV format. So CSV (Comma-separated values) file stores tabular data, that looks like numbers and text, in plain text. Each line of the file is a data record. Each record consists of one or more fields, separated by commas. In addition, the term "CSV" also denotes some closely related delimiter-separated formats that use different field delimiters. It is easy to add the data from such a file on a map, when it contains the information only about points and their attributes. In this case one field contains the longitude of the point, and in another field there is the latitude of the point.
For example the file with the information about the major world cities looks like this:
longitude,latitude,NAME,COUNTRY,POPULATION,CAPITAL
33.08604049999976,68.96354674999974,Murmansk,Russia,468000,N
40.646160130000375,64.52066803000004,Arkhangelsk,Russia,416000,N
30.453327180000375,59.95188904000009,Saint Petersburg,Russia,5825000,N
150.78001403999605,59.57099915000014,Magadan,Russia,152000,N
120.23000336000206,23.170000080000083,Tai-nan,Taiwan,656927,N
60.610130310000386,56.84654235999987,Yekaterinburg,Russia,1620000,N
43.9406700100003,56.28967667000006,Nizhniy Novgorod,Russia,2025000,N
-4.269947530000034,55.86280822999996,Glasgow,UK,1800000,N
120.23000336000206,23.170000080000083,Tai-nan,Taiwan,656927,N
61.39261246000016,55.14500045999982,Chelyabinsk,Russia,1325000,N
73.25028992000036,55.063304900000205,Omsk,Russia,1175000,N
82.94284821000016,55.03210067999992,Novosibirsk,Russia,1600000,N
56.09612655999974,54.82173537999994,Ufa,Russia,1100000,N
25.275966640000274,54.688568120000184,Vilnius,Lithuania,582000,Y
….
So according to the rules of every particular GIS, it is necessary to specify which fields are the fields with coordinates, then press "OK" button and here we get the map. We will tell how to do it with the help of QGIS and OpenWebGIS - Free and Open Source Geographic Information Systems.
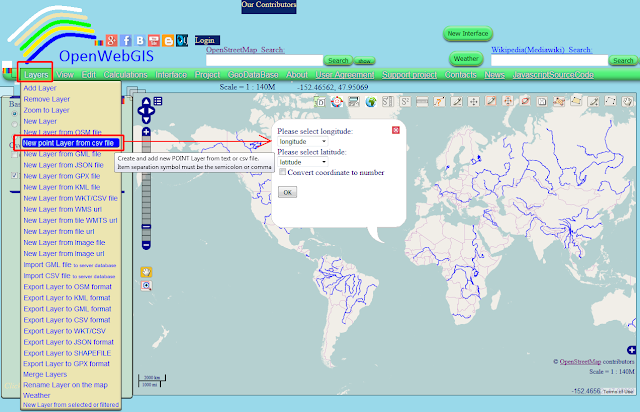
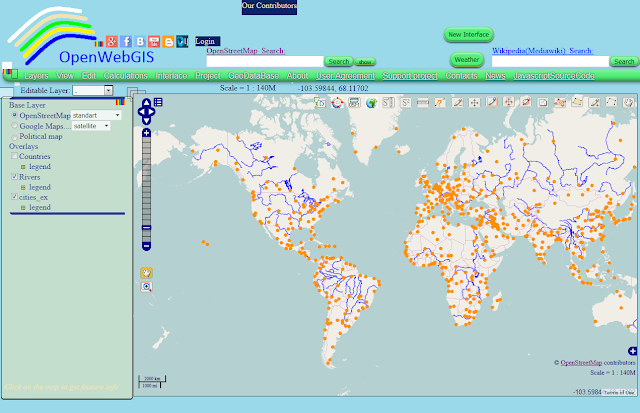
In OpenWebGIS it is done as shown in Figure 1 and 2. To do it - you can select menu item "Layer->New point Layer from csv file". First it is necessary to select CSV file with the help of "Browse" button, then fields with longitude and latitude.
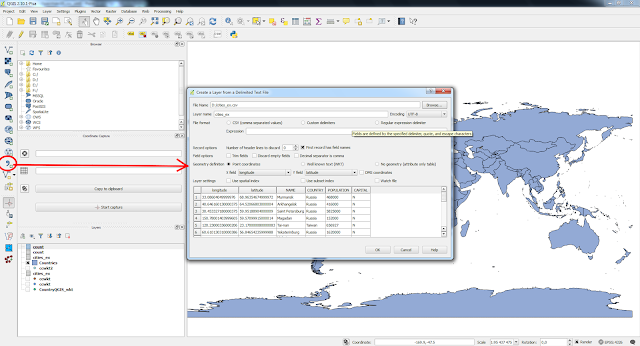
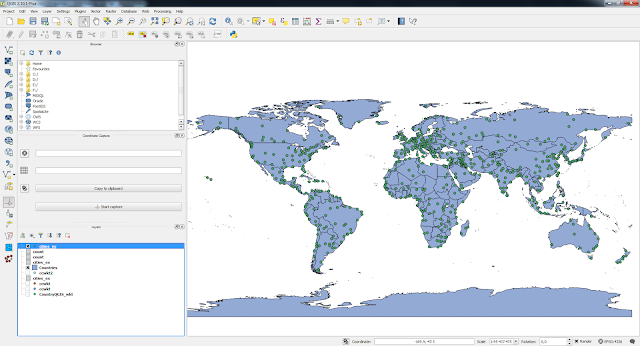
In QGIS it is done as shown in Figure 3 and 4. Click on the button "Create a Layer from a Delimited Text File" (selected by red circle) and set options like it shown in the Figure 3.
WKT_geometry;sovereignt;admin;subunit;name;name_long;brk_name;brk_group;postal;formal_en;formal_fr;note_brk;name_sort;name_alt;pop_est;gdp_md_est;pop_year;lastcensus;gdp_year;economy;income_grp;wikipedia;continent;region_un;subregion
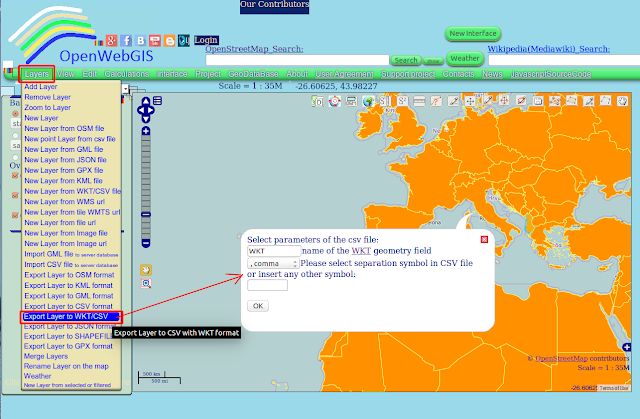
Suppose there is already a geographic layer on the map with the boundaries of countries (i.e. polygons). This layer has several attributes with information about each country. In order to export this information to a CSV file with a WKT geometry in it using OpenWebGIS, you need to select the layer you are interested in (in this case, Countries) in the list of “Editable Layer” and click on the menu item “Layers->Export Layer to WKT/CSV” (See Figure 5).
For example the file with the information about the major world cities looks like this:
longitude,latitude,NAME,COUNTRY,POPULATION,CAPITAL
33.08604049999976,68.96354674999974,Murmansk,Russia,468000,N
40.646160130000375,64.52066803000004,Arkhangelsk,Russia,416000,N
30.453327180000375,59.95188904000009,Saint Petersburg,Russia,5825000,N
150.78001403999605,59.57099915000014,Magadan,Russia,152000,N
120.23000336000206,23.170000080000083,Tai-nan,Taiwan,656927,N
60.610130310000386,56.84654235999987,Yekaterinburg,Russia,1620000,N
43.9406700100003,56.28967667000006,Nizhniy Novgorod,Russia,2025000,N
-4.269947530000034,55.86280822999996,Glasgow,UK,1800000,N
120.23000336000206,23.170000080000083,Tai-nan,Taiwan,656927,N
61.39261246000016,55.14500045999982,Chelyabinsk,Russia,1325000,N
73.25028992000036,55.063304900000205,Omsk,Russia,1175000,N
82.94284821000016,55.03210067999992,Novosibirsk,Russia,1600000,N
56.09612655999974,54.82173537999994,Ufa,Russia,1100000,N
25.275966640000274,54.688568120000184,Vilnius,Lithuania,582000,Y
….
So according to the rules of every particular GIS, it is necessary to specify which fields are the fields with coordinates, then press "OK" button and here we get the map. We will tell how to do it with the help of QGIS and OpenWebGIS - Free and Open Source Geographic Information Systems.
In OpenWebGIS it is done as shown in Figure 1 and 2. To do it - you can select menu item "Layer->New point Layer from csv file". First it is necessary to select CSV file with the help of "Browse" button, then fields with longitude and latitude.
However when using CVS there is necessity to manipulate not with points but with polygons and lines, then there are some troubles. How in this case to store the information about great number of polygon or line coordinates? How to read this data and add it on the map? One of the variants offered by QGIS and OpenWebGIS is to write the object geometry in one field in the popular format WKT. Well-known text (WKT) is a text markup language for representing vector geometry objects on a map. In this case CSV file with spatial geometry of countries (in WKT format), population, census year and so on may look like this (if the separation symbol is a semicolon ";"):
WKT_geometry;sovereignt;admin;subunit;name;name_long;brk_name;brk_group;postal;formal_en;formal_fr;note_brk;name_sort;name_alt;pop_est;gdp_md_est;pop_year;lastcensus;gdp_year;economy;income_grp;wikipedia;continent;region_un;subregion
MULTIPOLYGON(((-69.89912109 12.452001950000005,-69.89570313 12.422998049999999,-69.9421875 12.438525390000006,-70.00415039 12.500488279999999,-70.06611328 12.54697266,-70.05087891 12.597070309999998,-70.03510742 12.614111330000004,-69.97314453 12.567626950000001,-69.91181641 12.48046874999999,-69.89912109 12.452001950000005)));Netherlands;Aruba;Aruba;Aruba;Aruba;Aruba;;AW;Aruba;;;Aruba;;103065.0;2258.0;-99.0;2010.0;-99.0;6. Developing region;2. High income: nonOECD;-99.0;North America;Americas;Caribbean
MULTIPOLYGON(((74.89130859 37.231640619999986,74.84023438 37.22504883,74.76738281 37.249169919999986,74.73896484 37.285644529999985,74.72666016 37.29072266,74.66894531 37.26669922000001,74.55898438 37.23662108999999,74.37216797 37.15771484000001,74.37617188 37.13735352,74.49794922 37.057226559999975,74.52646484 37.03066405999997,74.54140625000001 37.02216796999999,74.43105469 36.983691409999985,74.19472656 36.896875,74.03886719000002 36.82573241999999,74.00185547 36.82309570000001,73.9078125 36.85292969000001,73.76914063 36.888476559999994,73.73183594 36.88779296999997,73.41113281 36.881689449999996,73.11679688 36.86855468999999,72.99375 36.85161132999997,72.76621094 36.83500977,72.62285156 36.82958983999998,72.53134766 36.802001950000005,72.43115234 36.76582031,72.32695313 36.74238281,72.24980469 36.7347168,72.15673828 36.70087890999999,72.09560547 36.63374022999999,71.92070313 36.53417968999999,71.82226563 36.48608397999998,71.77265625 36.43183593999998,71.71640625 36.42656250000001,71.62050781 36.43647461,71.54589844 36.37768554999999,71.46328125 36.29326172,71.31259766 36.171191410000006,71.23291016 36.12177733999998,71.18505859 36.04208983999999,71.22021484 36.00068358999999,71.34287109
…...........
Let's describe how to create such files in OpenWebGIS and QGIS and how to add on the map the information from them. MULTIPOLYGON(((74.89130859 37.231640619999986,74.84023438 37.22504883,74.76738281 37.249169919999986,74.73896484 37.285644529999985,74.72666016 37.29072266,74.66894531 37.26669922000001,74.55898438 37.23662108999999,74.37216797 37.15771484000001,74.37617188 37.13735352,74.49794922 37.057226559999975,74.52646484 37.03066405999997,74.54140625000001 37.02216796999999,74.43105469 36.983691409999985,74.19472656 36.896875,74.03886719000002 36.82573241999999,74.00185547 36.82309570000001,73.9078125 36.85292969000001,73.76914063 36.888476559999994,73.73183594 36.88779296999997,73.41113281 36.881689449999996,73.11679688 36.86855468999999,72.99375 36.85161132999997,72.76621094 36.83500977,72.62285156 36.82958983999998,72.53134766 36.802001950000005,72.43115234 36.76582031,72.32695313 36.74238281,72.24980469 36.7347168,72.15673828 36.70087890999999,72.09560547 36.63374022999999,71.92070313 36.53417968999999,71.82226563 36.48608397999998,71.77265625 36.43183593999998,71.71640625 36.42656250000001,71.62050781 36.43647461,71.54589844 36.37768554999999,71.46328125 36.29326172,71.31259766 36.171191410000006,71.23291016 36.12177733999998,71.18505859 36.04208983999999,71.22021484 36.00068358999999,71.34287109
…...........
Suppose there is already a geographic layer on the map with the boundaries of countries (i.e. polygons). This layer has several attributes with information about each country. In order to export this information to a CSV file with a WKT geometry in it using OpenWebGIS, you need to select the layer you are interested in (in this case, Countries) in the list of “Editable Layer” and click on the menu item “Layers->Export Layer to WKT/CSV” (See Figure 5).
After this a popup window with the respective export options will open. It is possible to specify the name of the field that will contain geographic geometry in WKT format. You can also specify a separation symbol for the fields – the semicolon or any other symbol (such as @, #, $, etc.)
If you name the field with the WKT geometry, then this file opens simply as a Geographic layer in QGIS on the map. This is because QGIS sees a field named WKT and uses this value to represent the geometry of each record on the map.
After setting all the options in the window shown in Figure 5, click button "OK". A window will open with the content of the created file. If you wish, you can right here make adjustments to it. Then save this file by clicking on the button "Save Data" (See Figure 6).
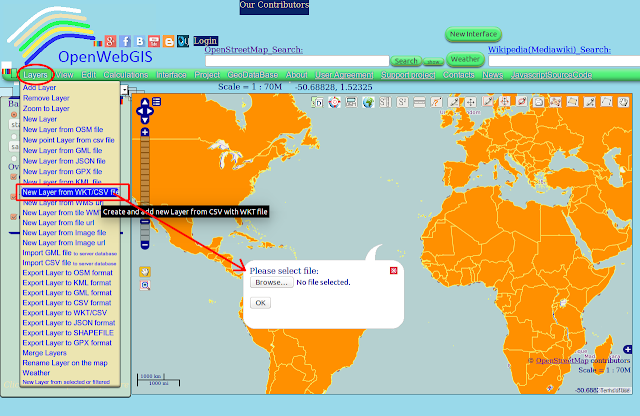
To add a CSV file with a WKT geometry you need to select the menu item "Layers->New Layer from WKT/CSV file". This will bring a popup window in which using the "Browse" button you can select a file stored on your local disk (See Figure 7).
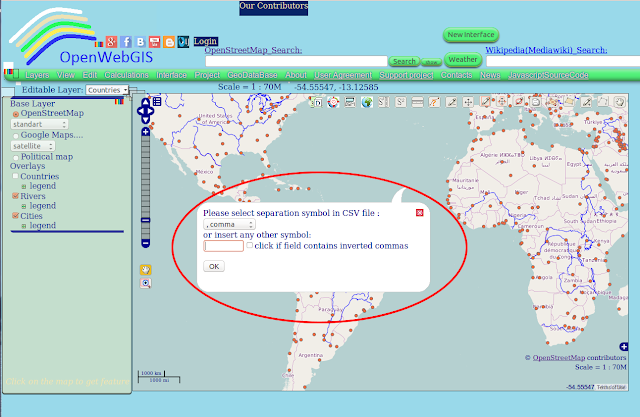
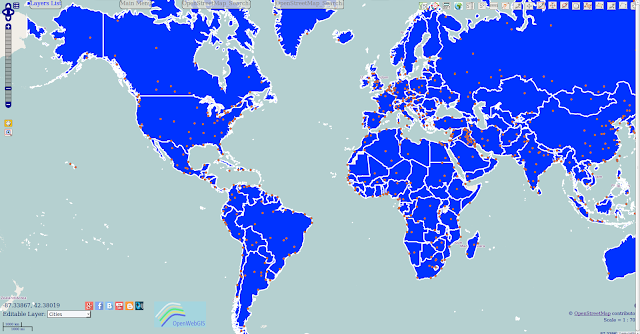
Then you click "OK" and you will see the next popup window where you can specify the separation symbol, click "OK" (See Figure 8), in the next popup window you need to specify the name of the field which contains the WKT geometry (See Figure 9), and finally to add a layer to the map click the "OK" button. The result in one of the interface variants of OpenWebGIS will look as shown in Figure 10.
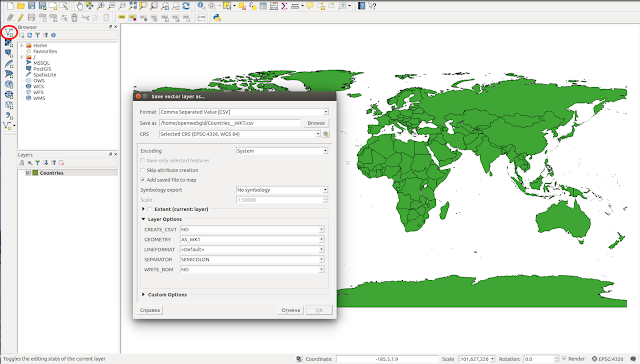
In QGIS the export to CSV file with WKT is done in the following way on the example of QGIS 2.10 version:
Right click on "Countries" layer in the projects TOC (table of contents) and select "Save As..."(See Figure 11)
Right click on "Countries" layer in the projects TOC (table of contents) and select "Save As..."(See Figure 11)
- In Save Vector Layer As dialog enter the following for the fields:
- Format: Comma Separated Value [CSV]
- Save As: path and the file name, Countries__WKT.csv
- Layer: GEOMETRY=AS_WKT
- (use default values for other fields)
أكثر...


