[h=2]Cluster and Outlier Analysis (Anselin Local Morans I) arcgis[/h]

You will first examine the data generally to determine if median household income is clustered or dispersed in Middlesex County, then you will run local statistical tests to see where clusters exist.
1. Open ArcMap and a blank map.
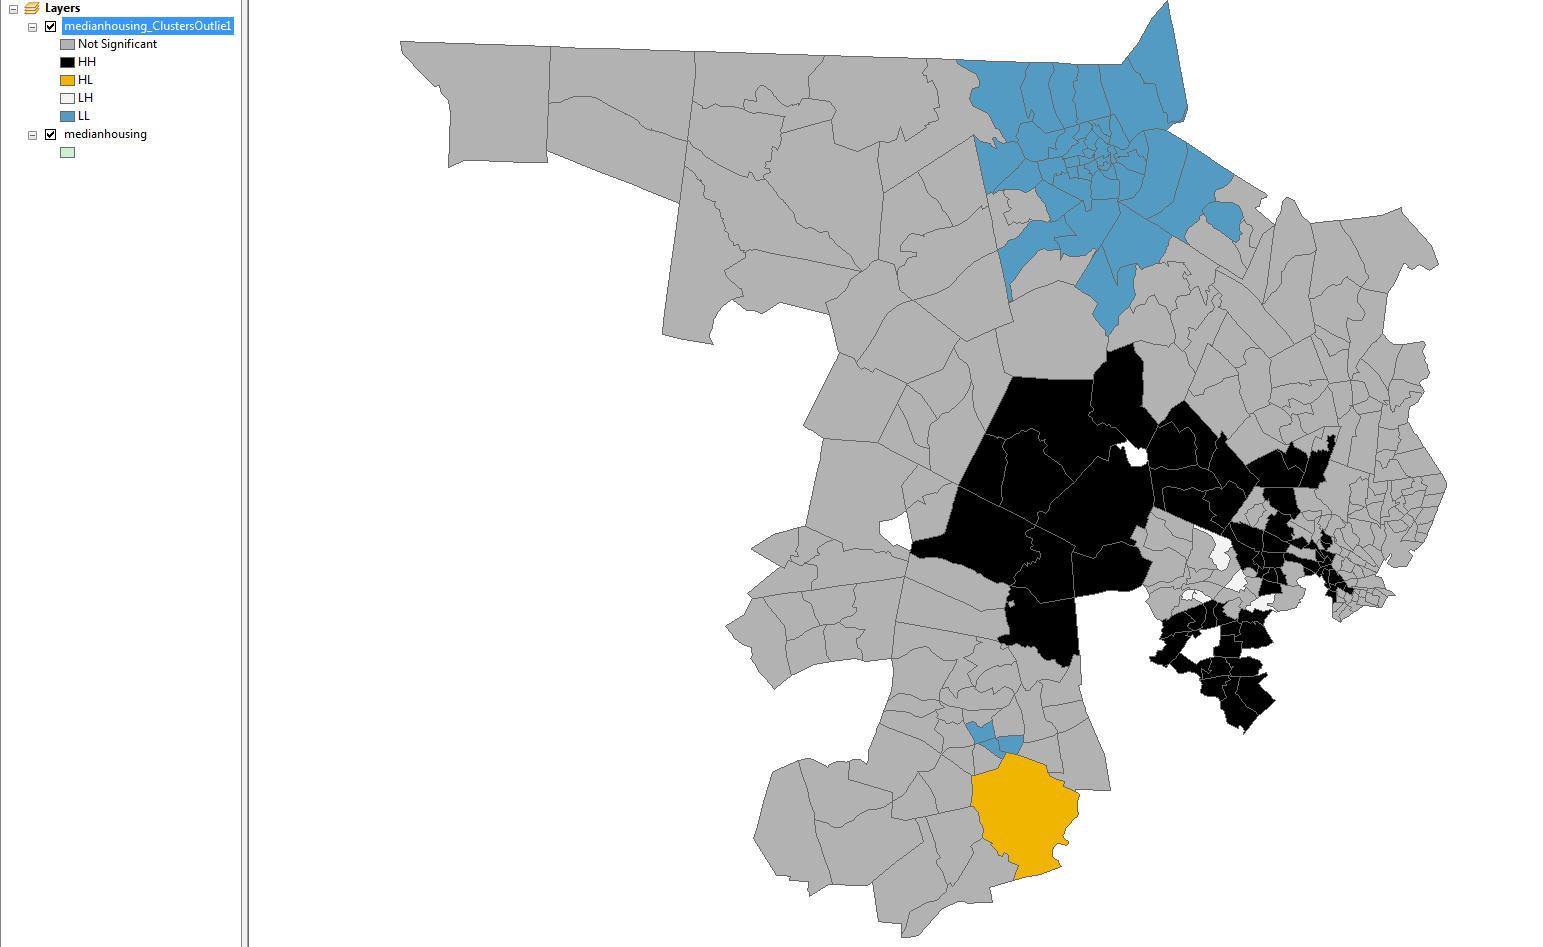
2. Add the data layer, “medianhousing” to the map from your folder on the desktop.
In the following exercises you will use the default setting for spatial weights in each tool, however you also have the option of creating a spatial weights matrix using this tool: Spatial Statistics > Modeling Spatial Relationships > Generate Spatial Weights Matrix. If you are familiar with network analysis you can construct a spatial weights matrix based on your road network using the Generate Network Spatial Weights tool.
[h=3]Calculating General Clustering[/h]1. Open ArcMap and a blank map.
2. Add the data layer, “medianhousing” to the map from your folder on the desktop.
In the following exercises you will use the default setting for spatial weights in each tool, however you also have the option of creating a spatial weights matrix using this tool: Spatial Statistics > Modeling Spatial Relationships > Generate Spatial Weights Matrix. If you are familiar with network analysis you can construct a spatial weights matrix based on your road network using the Generate Network Spatial Weights tool.
You will first run the Getis-Ord General G statistic to see if areas with a high or low median income are clustered.
1. Open the toolbox if is it not already open by clicking Geoprocessing > ArcToolbox.
2. Expand Spatial Statistics Tools.
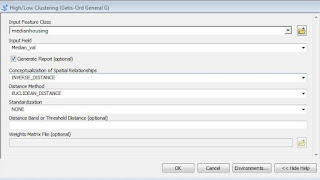
3. From the Analyzing Patterns tools, select High/Low Clustering (Getis Ord General G).
4. For the input feature class, enter “medianhousing”. For the input field, select “Median_val”.
5. Check the box next to Generate Report.
6. Keep the Conceptualization and Distance methods as the default. Feel free to experiment with other conceptualizations after you run this analysis.
7. Click Ok.
ArcMap warns you that it used the distance of 12597.9 meters for the distance of the search threshold. By default, ArcMap will use the minimum distance to insure all features have at least one neighbor. You can change this distance to make the analysis more appropriate for your project. The larger the value, the more neighbors that will be considered during the calculation.
8. Once the test has finished running, click Geoprocessing > Results (in the top menu bar)
9. Expand Current Session and double click Report File: GeneralG_Results.html.
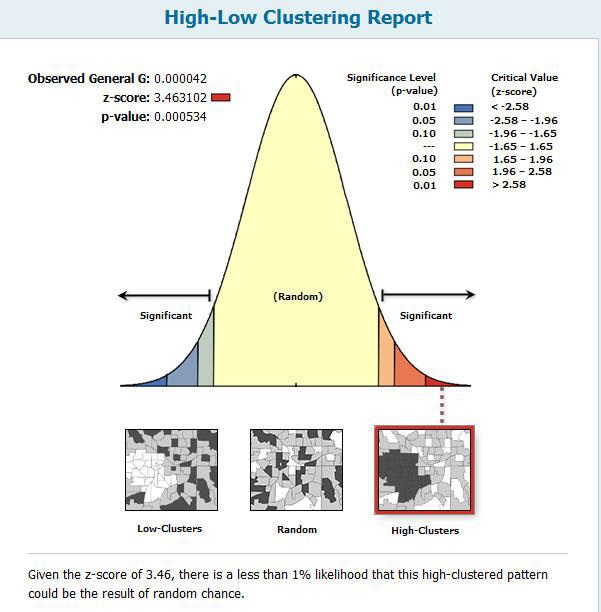
Q: What is the G score? What is the Z score? What does this tell you?
A: Because the Z score is highly significant, the median household income in each tract is significantly more clustered than a random pattern.
Next you will run a spatial autocorrelation test to see if the general pattern of features is clustered or dispersed (as opposed to clustering specifically of high or low values).
10. Select Spatial Autocorrelation from the Analyzing Patterns menu and input the same information as you did for the General G test.
11. Check the box for “generate report”
12. Once the test has finished running, expand the Spatial Autocorrelation category under Current Session in the results window and double click on the report, MoransI_Results2.html.
13. Double click on the HTML report.
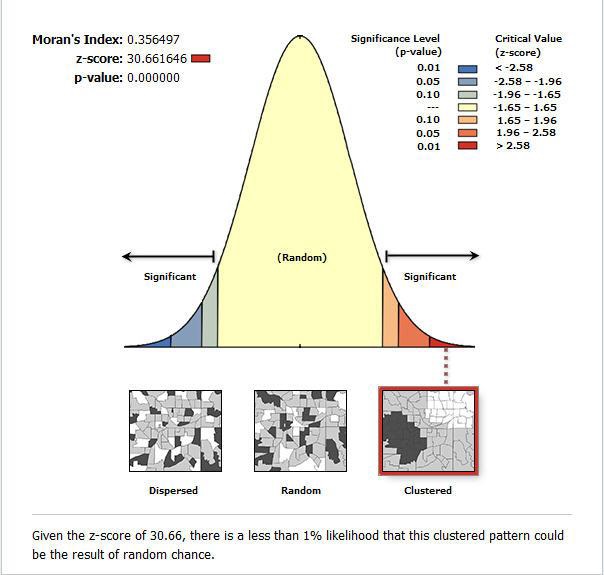
Q: What are the results? What does this tell you?
A: The median housing values are clustered at a significance level of p
1. Open the toolbox if is it not already open by clicking Geoprocessing > ArcToolbox.
2. Expand Spatial Statistics Tools.
3. From the Analyzing Patterns tools, select High/Low Clustering (Getis Ord General G).
4. For the input feature class, enter “medianhousing”. For the input field, select “Median_val”.
5. Check the box next to Generate Report.
6. Keep the Conceptualization and Distance methods as the default. Feel free to experiment with other conceptualizations after you run this analysis.
7. Click Ok.

ArcMap warns you that it used the distance of 12597.9 meters for the distance of the search threshold. By default, ArcMap will use the minimum distance to insure all features have at least one neighbor. You can change this distance to make the analysis more appropriate for your project. The larger the value, the more neighbors that will be considered during the calculation.
8. Once the test has finished running, click Geoprocessing > Results (in the top menu bar)
9. Expand Current Session and double click Report File: GeneralG_Results.html.

Q: What is the G score? What is the Z score? What does this tell you?
A: Because the Z score is highly significant, the median household income in each tract is significantly more clustered than a random pattern.
Next you will run a spatial autocorrelation test to see if the general pattern of features is clustered or dispersed (as opposed to clustering specifically of high or low values).
10. Select Spatial Autocorrelation from the Analyzing Patterns menu and input the same information as you did for the General G test.
11. Check the box for “generate report”
12. Once the test has finished running, expand the Spatial Autocorrelation category under Current Session in the results window and double click on the report, MoransI_Results2.html.
13. Double click on the HTML report.

Q: What are the results? What does this tell you?
A: The median housing values are clustered at a significance level of p