<div dir="ltr" style="text-align: left;" trbidi="on">

<div style="text-align: justify;">Look at the interesting map of the most destructive earthquakes (with magnitude of 8 to 10 values) from 1905 to 2014. The data for this map was taken from USGS. USGS is a science bureau within the United States Department of the Interior. It can be available with menu item of OpenWebGIS: "GeoDataBase-> Earthquakes Database".
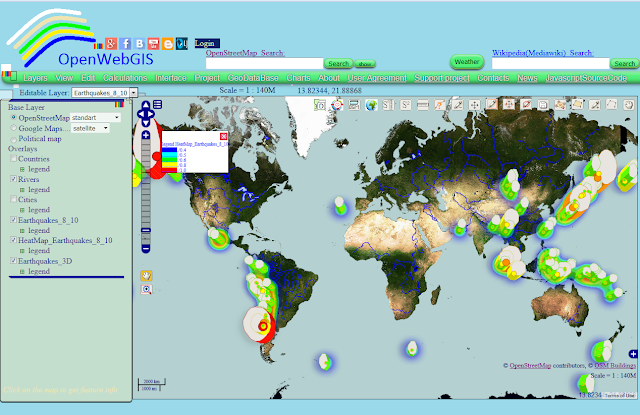 Figure 1
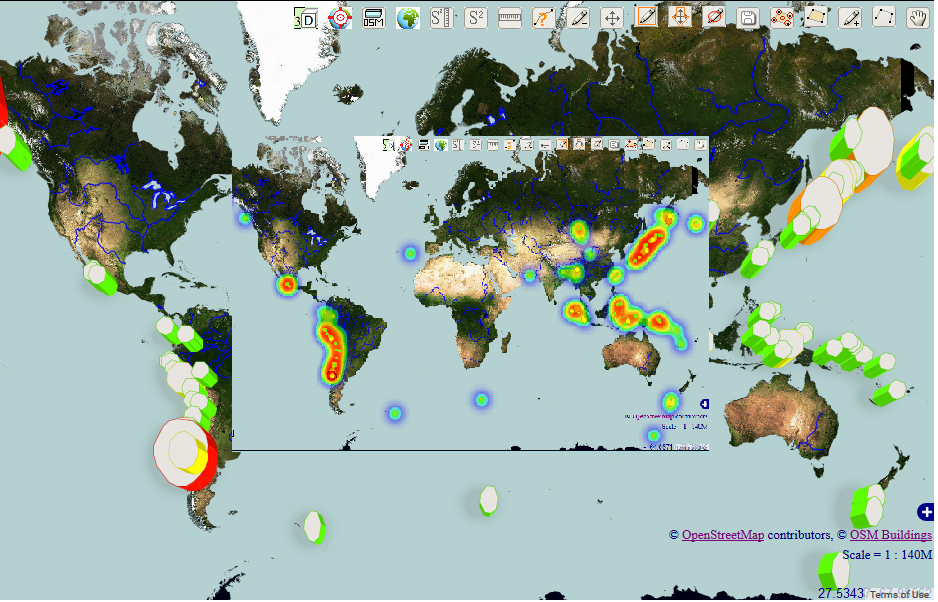
 Figure 2Screenshots of this map are shown on the Figure 1 and Figure 2. The map for online interaction with it you can see at this link: Map
The map is interesting, because it is presents the data in 3 ways:
1. With the help of heatmap - please read about heatmap creation in OpenWebGIS in these articles: "Heatmap and Interpolation in OpenWebGIS (very easy and interesting)" and "How to create a heatmap on the map using JavaScript, Openlayers and canvas".
2. With the help of usual points the color of which depends on the magnitude of the earthquake. The values
أكثر...
<div style="text-align: justify;">Look at the interesting map of the most destructive earthquakes (with magnitude of 8 to 10 values) from 1905 to 2014. The data for this map was taken from USGS. USGS is a science bureau within the United States Department of the Interior. It can be available with menu item of OpenWebGIS: "GeoDataBase-> Earthquakes Database".
 Figure 1
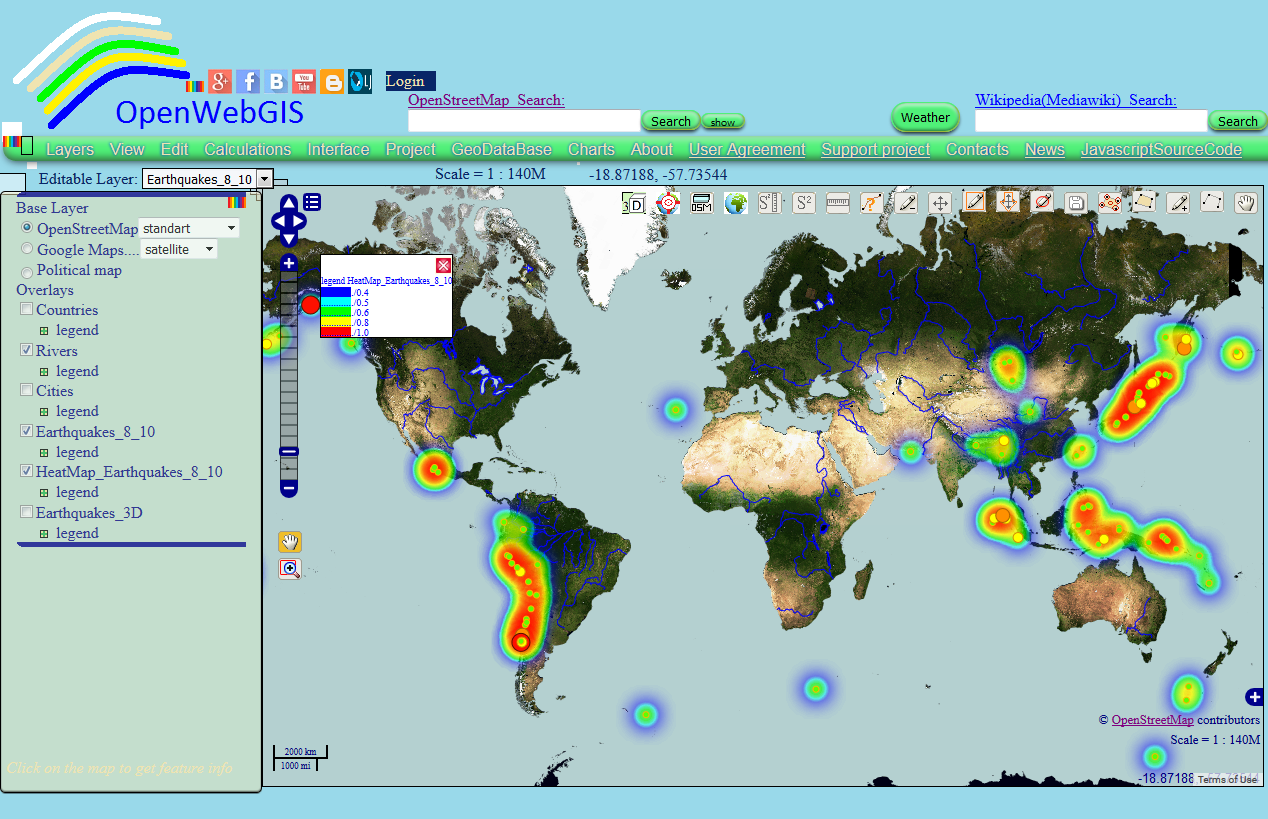 Figure 2Screenshots of this map are shown on the Figure 1 and Figure 2. The map for online interaction with it you can see at this link: Map
The map is interesting, because it is presents the data in 3 ways:
1. With the help of heatmap - please read about heatmap creation in OpenWebGIS in these articles: "Heatmap and Interpolation in OpenWebGIS (very easy and interesting)" and "How to create a heatmap on the map using JavaScript, Openlayers and canvas".
2. With the help of usual points the color of which depends on the magnitude of the earthquake. The values
أكثر...