Previously, I've written about Being Weather Ready: The Open Source Way and Weather GIS, Data, and Viewers. I would probably stop blogging about the weather if there weren't bigger storms each year. Family, friends, and coworkers often ask me what the weather will be like or get confused about updated/changing predictions. Maybe yours do to!
Local Forecast Office
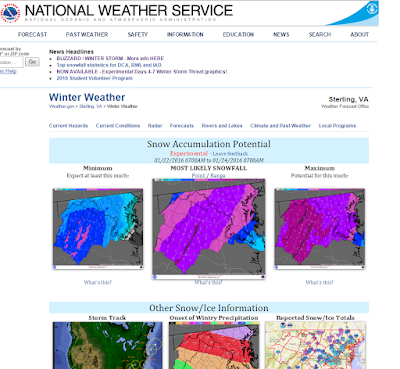
The National Weather Service (NWS) has local forecast offices spread throughout the country. Often, the offices have specific pages to deal with certain weather threats.
For example, the Sterling Office for DC-Virginia-Maryland has a Winter Weather Page: http://www.weather.gov/lwx/winter. The maps below show the:
 The NWS packs a lot of information neatly into their web page.
Although a 'long' web page, there is a clear hierarchy of information from
most important to least important and specific weather information to
general climate information.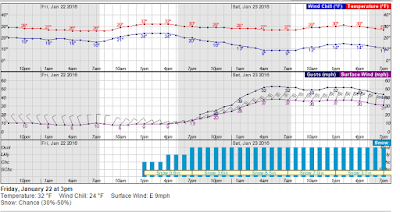 Some weather information can't be captured well on maps, so you will also have to look at graphs.
NWS also has a GIS Data Portal (http://www.nws.noaa.gov/gis/) so you can make your own maps. But you don't have to go through all those steps and can use web-based map tools like NOWCOAST (http://nowcoast.noaa.gov/) for real-time information and the easier to use Enhanced Data Display (http://preview.weather.gov/edd/). There is also a briefing site: http://www.weather.gov/briefing/
Map Examples
Some maps convey their message better than others. Weather maps are no exception...What do you think about the maps below? You be the judge...
Easiest on the Eyes
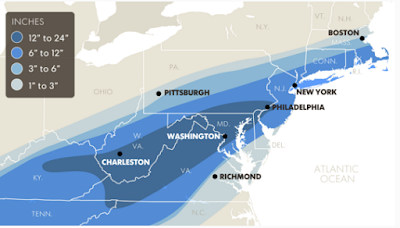
USA Today had the most pleasing storm map that I could find. Simple and effective.
 Source: USA TodayHard on the Eyes
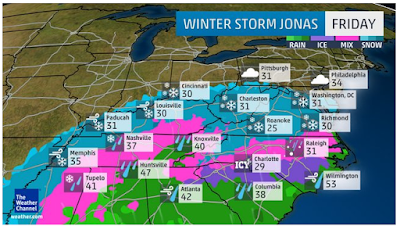
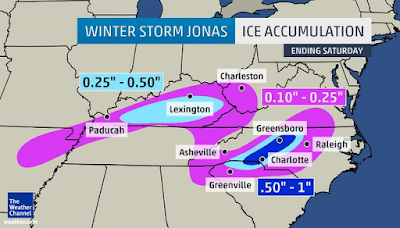
The Weather Channel loves translucent boxes, apparently. This map of regional temperatures and precipitation probably combines too much information on one map.
 Source: Weather Channel via AccuWeather
Too Slow...but...
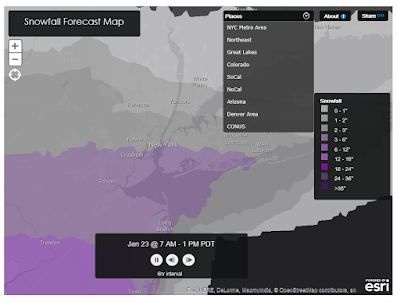
Lastly, it is notable to add that ESRI deploys personnel for large disasters, and usually posts a quick map. Although in this case, their snow map animation is nothing to get excited about: http://www.esri.com/services/disaster-response/severe-weather/us-snowfall-forecast.
 Slow animation but spatial bookmarks (drop-down at the top) are a nice touch and speed navigation.
أكثر...
NOAA has recently quadrupled their computing power which will lead to better forecasts for everything from winter storms to major hurricanes.
Fortunately, there is a lot of great information, maps, and data out there, if you know where to look! Winter storms don't carry official names. But,the Weather Channel has adopted this idea and named the upcoming storm "Jonas." Be sure to check back, as I will update the page with post-storm information!Local Forecast Office
The National Weather Service (NWS) has local forecast offices spread throughout the country. Often, the offices have specific pages to deal with certain weather threats.
For example, the Sterling Office for DC-Virginia-Maryland has a Winter Weather Page: http://www.weather.gov/lwx/winter. The maps below show the:
- At the top, links and headlines highlight key weather threats and message
- Minimum, most likely, and maximum amount of snowfall
- Storm track, time of onset, and reported snowfalls are all clearly labeled.
- Warning areas are highlighted at a county level. Clicking the map takes you to the local forecast in text--with additional links to hourly graphs.
- Probabilities are given for different snowfall amounts
- Weather fronts are highlighted nationally
- Lastly, always check the time stamp of the forecast map, since forecasts change frequently.
 The NWS packs a lot of information neatly into their web page.
Although a 'long' web page, there is a clear hierarchy of information from
most important to least important and specific weather information to
general climate information.
 Some weather information can't be captured well on maps, so you will also have to look at graphs.
NWS also has a GIS Data Portal (http://www.nws.noaa.gov/gis/) so you can make your own maps. But you don't have to go through all those steps and can use web-based map tools like NOWCOAST (http://nowcoast.noaa.gov/) for real-time information and the easier to use Enhanced Data Display (http://preview.weather.gov/edd/). There is also a briefing site: http://www.weather.gov/briefing/
Map Examples
Some maps convey their message better than others. Weather maps are no exception...What do you think about the maps below? You be the judge...
Easiest on the Eyes
USA Today had the most pleasing storm map that I could find. Simple and effective.
- At this scale, the classification and increment of snowfall is appropriate. Although not described in the text, the mapmaker assumes the reader will see that Washington and Charleston, highlighted differently in white, will receive the most snowfall.
 Source: USA TodayHard on the Eyes
The Weather Channel loves translucent boxes, apparently. This map of regional temperatures and precipitation probably combines too much information on one map.
- Precipitation type is also classified into different colors and different icons (snowflakes and rain drops).
 Source: Weather Channel via AccuWeather
Too Slow...but...
Lastly, it is notable to add that ESRI deploys personnel for large disasters, and usually posts a quick map. Although in this case, their snow map animation is nothing to get excited about: http://www.esri.com/services/disaster-response/severe-weather/us-snowfall-forecast.
- However, one nice feature, which I wish I saw more of in other interactive maps, are spatial bookmarks that allow the viewer to jump to certain places in the map.
 Slow animation but spatial bookmarks (drop-down at the top) are a nice touch and speed navigation.
أكثر...