Instructor: Penelope Bishop Mitchell, TA: Brandon Deusenberry
Module 9: Flowline Mapping
Module 9 required students to undertake Flow Line Mapping. Flow maps utilize lines of varying width to depict the movement of phenomena between geographic locations. Students utilized Adobe Illustrator to create a distributive flow map to illustrate global immigration figures into the United States. Lab materials provided base maps produced in ArcMap, and left students with the task of rearranging continents and creating proportional flow lines and corresponding legends in accordance with design principles.
Lab Learning Outcomes:
- Assess design issues for flow line mapping
- Calculate proportional line widths using excel
- Utilize Adobe Illustrator to construct global scale flow map
- Create a final map that demonstrates proper cartographic and flow map design techniques
- Summarize and present lab objectives and outcomes
AND THE STUDENT SPOTLIGHT AWARD WINNER IS: Sarah Rehrer!
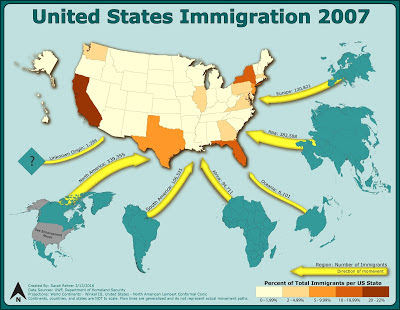
Sarah’s flow line map stood out for its clear presentation of data. Her effective implementation of the appropriate visual hierarchy is the map’s selling point. Flow lines and U.S. immigration data stand out above all other map elements. The map’s design demonstrates a competency with Adobe Illustrator--the flow line styling and placement is subtle yet effective, the drop shadow used on the U.S. map helps leverage that information, the monochromatic color choice for global continents creates map continuity and prevents distraction from excessive color in this particular map design. The choropleth legend has contiguous legend swatches in keeping with textbook choropleth legend design. The horizontal legend orientation is ideal for legend placement within available map space. The map elements are balanced throughout the page, with all objects being sized appropriately for easy viewing. Map information provides correct data sources, projection as well as other helpful information to aid in correct map interpretation. 
Sarah has also consistently drafted excellent blog posts. Her flow mapping post effectively explains the flow mapping concepts, lab objectives, as well as her process in creating her map. Outstanding work Sarah!!
Follow Sarah's work at her student blog: http://serehrergis.blogspot.com
This week we also have an Honorable Mention: Jorge Rosado!
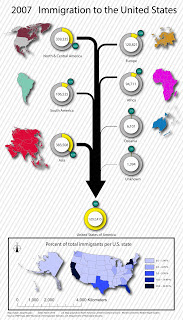
We would also like to recognize Jorge Rosado for originality of map design and excellent graphic design skills. Jorge’s map is reminiscent of a systems diagram, with the proportional line widths flowing into one major immigration line which flows into the United States immigration diagram. The pie charts and figures demonstrate extreme proficiency with Adobe Illustrator. Jorge consistently is pushing the boundaries of traditional map design to create innovative and skillful cartographic products. 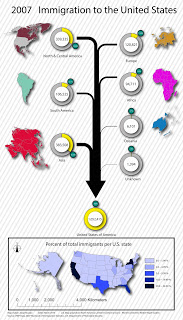
This guy has some serious talent! Keep it up Jorge!!
Follow Jorge's work at his student blog: http://donjorgerosado.blogspot.com
أكثر...