Combining Remote Sensing & Cloud technology is the future of farming
 Remote sensing & GIS technology in action – the future of smart agriculture
According to the FAO, the growth rates of global agricultural production and crop yields have slowed in the last couple of years, raising fears that the world may not be able to grow enough food and other commodities to ensure that future populations are adequately fed. Considering climate change as an important factor in world farm production, the growth rates of global production may further be endangered by failure of rains and occurrence of natural disasters such as floods and droughts leading to crop failures, food insecurity, famine and mass migration together with negative national economic growth. That’s why the risk management in agriculture is becoming an important tool for farmers to anticipate, avoid and react to shock.
Use of GIS in risk management as well as improving data visualisation and decision making process with the help of maps is becoming a standard for agencies, insurance companies and businesses around the world. Digital maps can display spatial correlations and patterns that are difficult to see in spreadsheet-based reports. Moreover, web based GIS solution can be an incredible tool for collaboration between stakeholders in risk management, namely insurance providers, farmers and governmental agencies.
We bring you a case study with an example of an agricultural risk management project where insurance company used airborne multispectral imagery to evaluate the impact hail damage on corn for the purpose of insurance claim assessment.
Goals and Challenges
The insurance company used drone generated NDVI map to have an overview of the hail damage in corn. This was a pilot project designed for improving their damage assessment process. They needed a solution for field inspection, data sharing and collaboration between the parties involved in an insurance claim case. *
Their main goal was to create a solution combining Remote sensing technology with related ancillary data collection within GIS to gain an advanced and accurate tool for assisting with crop hail damage insurance settlements in minimal time and without conflict, while keeping expenses low. The challenge was in finding the best way for sharing large raster datasets with farmers without experience in GIS, together with improving the collaboration process so that settlements could be done in a more efficient way.
Workflow
A few days after the hail, the insurance company used drones to create an overview of the corn field crop damage. The area of 660 acres was mapped using MaVinci Sirius Pro unmanned vehicle. 758 images were generated by UAV, using RTK GPS positioning system and near-infrared sensor imagery. The results of drone image processing were orthomosaic, NDVI_rainbow, NDVI_heat and NDVI_gray images.
 Insurance company used NDVI map to determine the intensity and area of crop fields damage
NDVI map was of great help for the field inspection process. After processing data, analysts from insurance company were able to determine which areas require their immediate attention. Data visualisation helped them to make the workflow more efficient – they knew where to go and take the samples just from a quick look to a map.
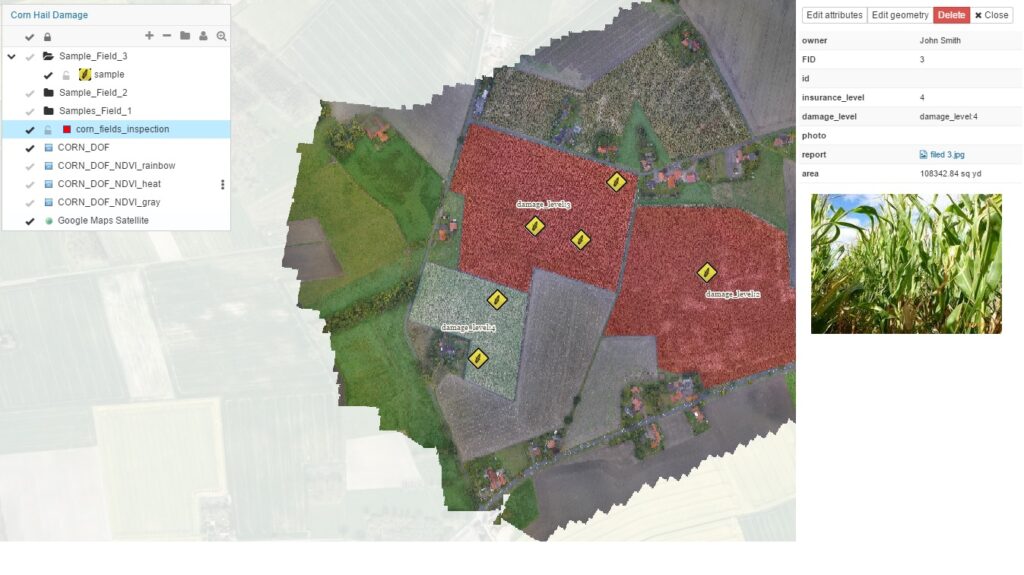
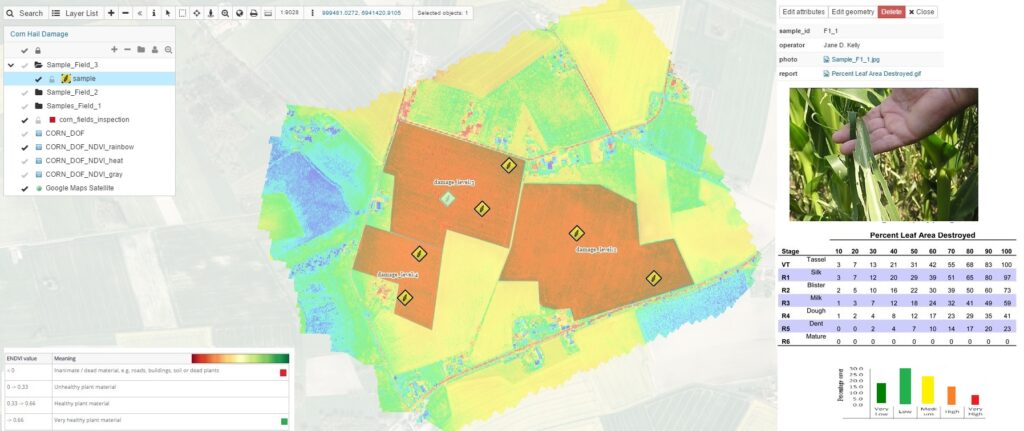
Sensor data was uploaded to different layers through Map Editor, making it available on the cloud and therefore easily accessible. Insurance company used polygon layers to mark the insured areas with additional information on insurance levels for each sector, together with damage indexes provided by processing the NDVI data. One layer*included the sample data from the field investigation.
Analysts used NDVI map as a basemap for field investigation with the help of Mobile Data Collection<span style="font-weight: 400;"> application to pinpoint locations where field samples were taken (marked in yellow), together with attaching field photos directly to the marked location. Later, these locations were updated with the scouting results in the form of pdf, making all the data available on a web map. ‘Samples’ layer was populated with three types of sample data for each area: red NDVI area (
According to the FAO, the growth rates of global agricultural production and crop yields have slowed in the last couple of years, raising fears that the world may not be able to grow enough food and other commodities to ensure that future populations are adequately fed. Considering climate change as an important factor in world farm production, the growth rates of global production may further be endangered by failure of rains and occurrence of natural disasters such as floods and droughts leading to crop failures, food insecurity, famine and mass migration together with negative national economic growth. That’s why the risk management in agriculture is becoming an important tool for farmers to anticipate, avoid and react to shock.
Use of GIS in risk management as well as improving data visualisation and decision making process with the help of maps is becoming a standard for agencies, insurance companies and businesses around the world. Digital maps can display spatial correlations and patterns that are difficult to see in spreadsheet-based reports. Moreover, web based GIS solution can be an incredible tool for collaboration between stakeholders in risk management, namely insurance providers, farmers and governmental agencies.
We bring you a case study with an example of an agricultural risk management project where insurance company used airborne multispectral imagery to evaluate the impact hail damage on corn for the purpose of insurance claim assessment.
Goals and Challenges
The insurance company used drone generated NDVI map to have an overview of the hail damage in corn. This was a pilot project designed for improving their damage assessment process. They needed a solution for field inspection, data sharing and collaboration between the parties involved in an insurance claim case. *
Their main goal was to create a solution combining Remote sensing technology with related ancillary data collection within GIS to gain an advanced and accurate tool for assisting with crop hail damage insurance settlements in minimal time and without conflict, while keeping expenses low. The challenge was in finding the best way for sharing large raster datasets with farmers without experience in GIS, together with improving the collaboration process so that settlements could be done in a more efficient way.
Workflow
A few days after the hail, the insurance company used drones to create an overview of the corn field crop damage. The area of 660 acres was mapped using MaVinci Sirius Pro unmanned vehicle. 758 images were generated by UAV, using RTK GPS positioning system and near-infrared sensor imagery. The results of drone image processing were orthomosaic, NDVI_rainbow, NDVI_heat and NDVI_gray images.
 Insurance company used NDVI map to determine the intensity and area of crop fields damage
“NDVI or Normalized Difference Vegetation Index is a measurement of the amount of live vegetation in an area and is commonly used for agricultural assessment. The basic principle of NDVI relies on the fact that, due to their spongy layers found on their backsides, leaves reflect a lot of light in the near infrared, in stark contrast with most non-plant object. When the plant becomes dehydrated or stressed, the spongy layer collapses and the leaves reflect less NIR light, but the same amount in the visible range. Thus, mathematically combining these two signals can help differentiate plant from non-plant and healthy plant from sickly plant.”
Insurance company consultants and analysts can use NDVI data to determine the intensity and area of crop fields damage by analyzing NDVI pixel intervals using NDVI map (with a scale range from -1 to +1). Inanimate or dead material (roads, buildings, soil or dead plants) is displayed in red, while plants are displayed in green, making the hail damaged area easily visible on a map. This analysis helps generating parameters for insurance claim assessments.
NDVI map was of great help for the field inspection process. After processing data, analysts from insurance company were able to determine which areas require their immediate attention. Data visualisation helped them to make the workflow more efficient – they knew where to go and take the samples just from a quick look to a map.

Sensor data was uploaded to different layers through Map Editor, making it available on the cloud and therefore easily accessible. Insurance company used polygon layers to mark the insured areas with additional information on insurance levels for each sector, together with damage indexes provided by processing the NDVI data. One layer*included the sample data from the field investigation.
Analysts used NDVI map as a basemap for field investigation with the help of Mobile Data Collection<span style="font-weight: 400;"> application to pinpoint locations where field samples were taken (marked in yellow), together with attaching field photos directly to the marked location. Later, these locations were updated with the scouting results in the form of pdf, making all the data available on a web map. ‘Samples’ layer was populated with three types of sample data for each area: red NDVI area (